After the bell on Wednesday, coffee giant Green Mountain Coffee Roasters (GMCR) released its fiscal second quarter results. Q2 was extremely mixed, with the company missing revenue estimates, but blowing out earnings estimates. The company also issued terrible Q3 revenue guidance, and lowered its full year revenue forecast. On the heels of the earnings beat in Q2, they raised their full year earnings forecast and cash flow guidance. However, the company also slashed its capital expenditures forecast again. Aside from the quarterly report, the company announced an extended partnership with Starbucks (SBUX). Today, I'll break down the results and see where Green Mountain goes from here. For those that missed it, here was my earnings preview for the name.
Second Quarter results:
For the quarter, Green Mountain reported revenues of $1.005 billion. This represented 13.53% growth over the prior year period. However, the company rounded this growth to the nearest percent, and because it was over 13.5%, they showed 14% growth. While mathematically this is acceptable, it doesn't tell the whole story. When Green Mountain gave guidance at their Q1 report, they guided to a sales growth range of 14% to 18%. Looking at 14%, it looks like they hit the bottom end of their range, which they didn't. Additionally, analysts were looking for 15.8% growth, a little more than $1.02 billion, so Green Mountain missed that number by $20 million. Don't forget, analysts were expecting 20.2% growth going into the Q1 report. Green Mountain lowered the bar, and still missed terribly. This was not an impressive revenue quarter.
On the margin side, Green Mountain improved gross margins by 595 basis points. The following table, taken from their Q2 report, shows how this was achieved.
(click to enlarge)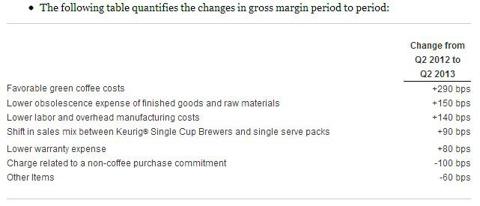
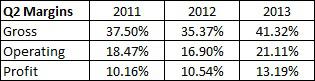
I will always give a company credit where it is due, and this was ! an extremely large jump in gross margins. The question going forward will be is it sustainable? Coffee prices will not decline forever, and some of the lower expenses they described can only go so low. Green Mountain did well in terms of margins, and their three primary margin categories over the past few years are below.
On the operating side, Green Mountain reported an increase in operating expenses of 24.23%, primarily driven by a 49.5% increase in general and administrative costs. Further down the income statement, the total of "other income items" went from a loss of $3.872 million to a loss of $6.231 million. This was partially offset by a lower tax rate at 35.61%, as opposed to 36.00% in the year ago period. As well as Green Mountain did on the gross margin side, the rest of the income statement hurt a bit. Their success did not flow down all the way.
On an earnings per share front, the company came in at $0.87 on a GAAP basis, four cents of which was helped by a lower share count due to the buyback. On a non-GAAP basis, which is what analysts use, Green Mountain came in at $0.93, which crushed analyst forecasts for $0.73.
Overall, this report reminds me of the past couple of years for Green Mountain. The company was light on sales, but had low enough expenses to fuel a huge earnings per share beat. Margin improvement was great, but it's not a good sign when you guide to 14% to 18% revenue growth, and you come in at 13.53%. That's a huge miss.
Another slashing of capex numbers:
Before I get to the rest of the company's guidance, which was poor, I want to briefly look at capital expenditures. Green Mountain's free cash flow numbers are calculated by subtracting capital expenditures for fixed assets from net cash provided by operating activities. The following is a recent history of Green Mountain's capex plans, spanning back about a ! year and ! a half.
When the company reported third-quarter results in 2011, it provided the following guidance for fiscal 2012:
Capital expenditures for fiscal 2012 in the range of $650 million to $720 million. In addition, as the Company secures new production facilities for future growth it may incur additional capital expenditures in the range of $50 million to $60 million in fiscal 2012.
When the company reported fourth-quarter results in 2011, the guidance changed to the following:
For fiscal 2012, we currently expect to invest between $630.0 million to $700.0 million in capital expenditures to support the Company's future growth.
The company did not revise its Capex guidance after first quarter results, but when it reported second-quarter results, it took down the forecast again:
Capital expenditures in the range of $525 million to $575 million.
When the company reported third-quarter results, it again took down the forecast for 2012 Capex.
Capital expenditures in the range of $475 to $525 million, down from prior estimates of $525 to $575 million.
When Green Mountain actually reported Q4, they reported free cash flow of $76.7 million and net cash provided by operating activities of $477.8 million. That means that capex was $401.1 million. So they initially guided to $700 million to $780 million in their prior fiscal year, and actually only put $401 million back into the business. That's why their free cash flow numbers looked so good.
That gets us to this fiscal year. At that Q4 report above, the company established the following capex and free cash flow guidance for this current fiscal year.
Free cash flow in a range of $100 million to $150 million. Capital expenditures in the range of $380 to $430 million.
So in Q1 they reported massive free cash flow of $254 million, and the following guidance.
Free cash flow in a range of $100 million to $150 million. Capital expenditures in the range of $350 to $400 million.
Since they ! lowered t! heir capex forecast by $30 million, you might have thought that they would have increased their free cash flow forecast? Nope, they didn't do it, they just said they expected to come in at the higher end. Well, in Q2 they had free cash flow of $202 million, giving a total of $456 million for the first half of the year.
Because they need to build inventory in the second half of the fiscal year, free cash flow actually goes negative in Q3 and Q4, which they tell us. That's fine, and no big deal. But here was their new guidance after this latest guidance after the Q2 report.
Free cash flow in a range of $300 million to $400 million. Capital expenditures in a range of $275 million to $325 million.
So the new forecast represents an increase of $200 million to $250 million. However, they cut capex guidance by $30 million last quarter, and another $75 million this quarter! Here's what they said after last quarter's Q1 call:
This revised capex represents approximately 8% of 2013 forecasted sales, down from 10% of sales in 2012 and 11% of sales in 2011.
Based on the new midpoints of their guidance, including the revenue guidance I'll get to in the next section, they are now expecting to invest just about 6.9% of sales. Again, this company is boosting its free cash flow numbers by cutting capital expenditures. Is this good for the long-term health of the business? That remains to be seen.
The rest of the guidance:
I would have been fine with the capex cut and free cash flow numbers had the company issued decent guidance, but they didn't!
For the full fiscal year, the company gave the following guidance:
Net sales growth in the range of 11% to 14% over fiscal year 2012.On a comparable basis, excluding the 53rd week of fiscal year 2012 which contributed $90 million in net sales in the Company's fourth quarter fiscal 2012, the Company's net sales growth outlook equates to growth in a range of 14% to 17%.On a comparable basis, the Company's expected fiscal 2013 reven! ue growth! rate is being driven by a 20% increase in the Company's core single serve business, offset by a 5% decline in its traditional coffee business, comprised of bagged coffee, fractional packs and office coffee services. As the entire coffee category's shift to Keurig® single serve continues, the Company's traditional coffee business will likewise continue to be adversely impacted.The Company continues to be comfortable with its longer-term outlook of annual net sales growth of 15% to 20%.Non-GAAP earnings per diluted share of $3.05 to $3.15, representing a growth rate of 27% to 31% over the $2.40 earnings per diluted share in fiscal 2012 (excluding the amortization of identifiable intangibles related to the Company's acquisitions; any acquisition-related transaction expenses; and legal and accounting expenses related to the SEC inquiry and the Company's pending securities and stockholder derivative class action litigation).On a comparable basis, excluding the 53rd week of fiscal year 2012 which contributed $0.07 in non-GAAP earnings per diluted share in the Company's fourth quarter of fiscal 2012, the Company's non-GAAP earnings per diluted share guidance equates to growth in a range of 31% to 35%.The Company's fiscal year 2013 non-GAAP earnings per diluted share estimate includes the impact of shares repurchased prior to March 30, 2013 as part of its previously announced share repurchase program, but excludes any impact from potential future Company share repurchases.Cash flow and capex guidance as detailed above.That seemed like a mouthful, didn't it? Of course it was, because by stuffing that much information, you may have missed the key point. The company significantly reduced its revenue guidance. Prior guidance was for net sales growth of 15% to 20%, but now they are calling for just 11% to 14%. That's a huge takedown! They threw in that statement about the extra week to make the growth look better, and yes, on a 52-week to 52-week period, it will be. But in previous reports, they never gave that! extra ti! dbit. They are just doing it here to "hide" their huge negative revision. They also claim it is due to a decrease in sales of bagged coffee as they move to more single serve. But still, it does not matter to me. They are warning on revenues.
Additionally, the earnings forecast was boosted, which makes sense on the heels of the huge Q2 beat, plus the lower share count. Analysts were looking for $2.84 in earnings, so they will definitely have to raise their forecasts there. Overall, the revenue midpoint reduction means they are lowering their forecast by about $193 million. For a company that was expecting a midpoint of $4.535 billion, almost $200 million is a big deal.
But wait, there's more! Here's the company's guidance for fiscal Q3, which is the quarter we are currently in.
Net sales growth in the range of 11% to 15% over the third quarter of fiscal year 2012.Non-GAAP earnings per diluted share in a range of $0.71 to $0.78, an increase of 37% to 50% over the prior year period (excluding the amortization of identifiable intangibles related to the Company's acquisitions; and, legal and accounting expenses related to the SEC inquiry and the Company's pending securities and stockholder derivative class action litigation).The Company's non-GAAP earnings per diluted share estimate includes the impact of shares repurchased prior to March 30, 2013 as part of its previously announced share repurchase program, but excludes any impact from potential future Company share repurchases.Now the earnings forecast is definitely great. Analysts were expecting $0.65, so the guidance is well above. However, if you factor in the share buybacks plus the huge rises in margins that they expect to carry through into Q3, I don't know if the forecast is that impressive. If analysts had known about this huge margin expansion, I think that their estimates would have been much higher.
But here's the real key, and it is revenues again. Analysts were expecting $1.02 billion for Q3, growth of 17.4%. The high e! nd of Gre! en Mountain's forecast didn't come anywhere near that. Green Mountain issued terrible revenue guidance for Q2, and they missed that completely. Q3 revenue guidance is even worse. The company is experiencing a much faster than expected revenue slowdown.
Balance Sheet / Cash Flow Highlights:
The company's balance sheet improved in Q2, thanks to that large earnings beat and help from free cash flow. Here's a summary table of some key financial ratios. Dollar values in thousands.
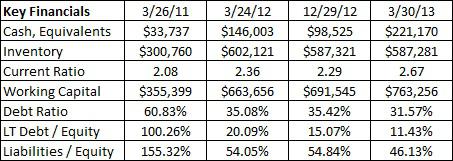
But the important part here is what's behind the numbers, rather than the numbers themselves. The company's cash position jumped because cash from operating activities was much higher and capex was lower, offset by the stock repurchases.
So let's look at the numbers behind the numbers. Through the first six months of the fiscal year, the company had cash flow from operating activities of $604.685 million. That was much higher than the $370.156 million in the year ago period (six months), a rise of about $234.5 million. But why did it rise so much? Here's the key points:
Net income rose by $42.57 million.Depreciation rose by $32 million.Last year's period included a $28.9 million gain on the sale of a subsidiary. This hurts cash flow, and is a subtraction to cash flow from operating activities.Inventory depletion was a $105 million add-back.Accounts payable and other expenses provided $3.7 million in cash this period, took away $17.5 million last year.The net income rising was a good thing, and I'll give them credit for that. There are also many other items I did not detail, so please look at the whole cash flow statement to get the line by line data.
But here's my takeaway. The company's cash flow improved by almost $235 million. Of that, there was a close to $29 million sale gain last year that hurt cash flow in that period. Also, there was a $105 million add t! o cash fl! ow for inventories above last year's period. When your inventories go from say $100 million to $80 million, that's a $20 million add to cash. Green Mountain depleted their inventories by an extra $105 million in the first 6 months of this year. Why did they do that? One reason is that they reduced their sales forecast! When you reduce your sales forecast by $200 million, you don't need as much inventory! So they didn't replenish as much. Also, another $21 million "improvement" was from them letting accounts payable and other current liabilities rise, instead of paying them back.
On the face of it, the rise in cash flow from operating activities looks tremendous. But when you dig into the numbers, there isn't a ton to like here. I'll give them some credit for improvement, but to give them credit for all $235 million, or maybe even half of that, is wrong.
Expanded Starbucks deal:
Despite all of the negativity I've detailed, Green Mountain shares rallied strongly in the after hours session. That was most likely due to a new deal with Starbucks announced along with the quarterly results. The deal is for a minimum of five years, and details are found below.
The new, minimum five-year agreement announced today is a global single-serve coffee industry game changer. Under the new agreement, Starbucks will add brands and varietals to the already robust Starbucks® K-Cup® and Vue® pack portfolio of offerings for Keurig® single cup brewers, ultimately tripling the number of Starbucks® products and adding brands offered on the Keurig® platform. New brands will include Seattle's Best Coffee®, Torrefazione Italia® coffee, Teavana® Teas, and Starbucks® Cocoa. The new agreement reinforces Starbucks position as the exclusive licensed super premium coffee brand on the Keurig® K-Cup® and Vue® platforms, and further extends the Keurig® system's position as the exclusive low-pressure single cup brewing system for fresh-brewed Starbucks® coffee, Tazo® tea and the aforementioned Starbuck! s brands.! Financial terms of the agreement were not disclosed.
It certainly seems that bulls are looking at the longer-term picture here, and that makes sense to a point. Green Mountain's relationship with Starbucks has always been in question, and has always been one of the clouds hanging over Green Mountain's head. They said on the conference call that the deal started once signed, so the weak guidance is even more disappointing given the partnership.
Final Thoughts / Recommendation:
In the after-hours session, Green Mountain shares rallied $9.57 to $69.05, a gain of 16.09%. More than 2.9 million shares traded in the after-hours session, after 6 million shares during the day. I'm sure that some of this rally was due to short covering, with more than 32 million shares short, almost 20% of the outstanding count, as of the latest update from NASDAQ. More shorts could cover Thursday.
Now I think Green Mountain's rise will probably continue a bit as short sellers are forced to cover, and bulls focus on the long-term aspect of the Starbucks deal. However, I think Green Mountain returns to the short candidate list with this report. That doesn't mean I am necessarily recommending you short it right away. In addition to the poor Q2 revenue number, the revenue guidance takedown, and slashing of capex, there is another argument to be made.
Let's go back to August 2012. Green Mountain announced a stock buyback at its earnings report, which helped the stock recover from a 52-week low around $15.25 in the after-hours session after reporting that quarter. We are now at $68.00. That is a tremendous rally. But here's the issue. The company has now slashed revenue guidance twice. Going into that Q4 report, analysts were expecting $4.72 billion in revenues this fiscal year, ending in September. At that point, Green Mountain guidance, using their current guidance for both fiscal years, was $4.39 billion to $4.58 billion. That was at the Q3 report, and thanks to a huge Q4 number, their forecast for th! is year w! as "technically raised" because the number for the previous fiscal year was higher. That put the new range at $4.44 billion to $4.63 billion. Going into this quarterly report, analysts were expecting $4.47 billion, the low end of this range. Given the new guidance, Green Mountain is looking for revenues of $4.28 billion to $4.40 billion. So now, we are even lower than the original range.
So what's going on with Green Mountain? Two years ago, the company grew revenues by 95.4%. In their prior fiscal year, which had an extra week, they grew by 45.6%. Their guidance for this year is just 11% to 14% net growth, or 14% to 17% growth excluding the extra week. Non-GAAP earnings per share two fiscal years ago were $1.64, and this year is expected to be almost twice that. But two years ago today, this stock traded for $76.50. Despite two years of explosive revenue and earnings growth, the stock is actually down, because that growth has tremendously slowed. Green Mountain expects that growth to pick back up over the long-term, which probably could occur when they expand further internationally. This Starbucks partnership could be the start of that.
So why do I think Green Mountain is a short candidate? Well, I think that this stock will pop on the news, but this quarterly report and guidance was terrible to be honest. The growth slowdown is happening even faster than expected, and the company is not investing in their business. Cash flow numbers aren't what they seem, and the stock is being propped up by the buyback and stock markets rallying to new highs. When the music stops, will this company have a chair?
I consider this name as a short candidate if this post-earnings rally is just too much. I think as this report is fully digested, I think the stock will pull back, especially if we see $75 or $80 in the short-term. Remember, this stock has recently gone from $15 to $68, and they actually lowered their revenue guidance even further. Green Mountain certainly had more upside like I said it wou! ld, but I! think further gains could be limited. In early 2012, Green Mountain went from the low $50s to $70 on a good earnings report. At their next earnings report, the stock was in the mid $20s, and fell another $10 from there. I don't think this stock will plunge like that again, but I don't think this massive rally will continue much higher.
Disclosure: I have no positions in any stocks mentioned, but may initiate a short position in GMCR over the next 72 hours. I wrote this article myself, and it expresses my own opinions. I am not receiving compensation for it (other than from Seeking Alpha). I have no business relationship with any company whose stock is mentioned in this article. (More...)
Additional disclosure: Investors are always reminded that before making any investment, you should do your own proper due diligence on any name directly or indirectly mentioned in this article. Investors should also consider seeking advice from a broker or financial adviser before making any investment decisions. Any material in this article should be considered general information, and not relied on as a formal investment recommendation.
No comments:
Post a Comment