Commercial banks in the United States are required to prove to their regulators that their investments are in fact "investment grade" as defined by the regulators. In this note we analyze the current levels and past history of default probabilities for Goldman Sachs Group (GS). We compare those default probabilities to credit spreads on 1,162 bond trades in 134 different company bond issues on July 31, 2013. This trading volume made Goldman Sachs Group the second most heavily traded name on the day, trailing only General Electric (GE) Credit Corporation. Goldman Sachs Group has some of the lowest default probabilities of any firm analyzed in this series of credit notes to date. Trading volume in these 134 Goldman Sachs Group bonds on July 31 totaled $358.3 million, and the analysis in this note is based on those traded prices.
Assuming the recovery rate in the event of default would be the same on all bond issues, a sophisticated investor who has moved beyond legacy ratings seeks to maximize revenue per basis point of default risk from each incremental investment, subject to risk limits on macro-factor exposure on a fully default-adjusted basis. We analyze the maturities where the credit spread/default probability ratio is highest for Goldman Sachs Group. We also consider whether or not a reasonable investor would judge the firm to be "investment grade" under the June 2012 rules mandated by the Dodd-Frank Act of 2010.
Definition of Investment Grade
On June 13, 2012, the Office of the Comptroller of the Currency published the final rules defining whether a security is "investment grade," in accordance with Section 939A of the Dodd-Frank Act of 2010. The new rules delete reference to legacy credit ratings and replace them with default probabilities as explained here.
Term Structure of Default Probabilities
Maximizing the ratio of credit spread to matched maturity default probabilities requires that default probabilities be available a! t a wide range of maturities. The graph below shows the current default probabilities for Goldman Sachs Group ranging from one month to 10 years on an annualized basis. The default probabilities range from 0.00% at one month to 0.00% at 1 year and 0.04% at ten years. Note that the default probabilities at the 1 month and 1 year maturity are not literally zero -- they are reported as zero only because of rounding to two decimal places.
(click to enlarge)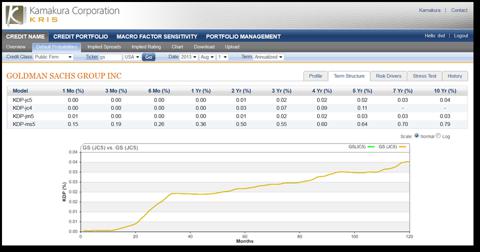
We explain the source and methodology for the default probabilities below.
Summary of Recent Bond Trading Activity
The National Association of Securities Dealers launched the TRACE (Trade Reporting and Compliance Engine) in July 2002 in order to increase price transparency in the U.S. corporate debt market. The system captures information on secondary market transactions in publicly traded securities (investment grade, high yield and convertible corporate debt) representing all over-the-counter market activity in these bonds. TRACE data for Goldman Sachs Group included 1,162 trades in 134 fixed-rate non-callable bonds of the firm on July 31, 2013.
The graph below shows 5 different yield curves that are relevant to a risk and return analysis of Goldman Sachs Group bonds. These curves reflect the noise in the TRACE data, as some of the trades are small odd-lot trades. The lowest curve, in dark blue, is the yield to maturity on U.S. Treasury bonds, interpolated from the Federal Reserve H15 statistical release for that day, that matches the maturity of the traded bonds of Goldman Sachs Group. The second lowest curve, in the lighter blue, shows the yields that would prevail if investors shared the default probability views outlined above, assumed that recovery in the event of default would be zero, and demanded no liquidity premium above and beyond the default-adjusted risk-free yield. The third line from the bottom (in orange) graphs! the lowe! st yield reported by TRACE on that day on Goldman Sachs Group bonds. The fourth line from the bottom (in green) displays the average yield reported by TRACE on the same day. The highest yield is obviously the maximum yield in each Goldman Sachs Group issue recorded by TRACE.
The data makes it very clear that there is a very large liquidity premium built into the yields of Goldman Sachs Group above and beyond the "default-adjusted risk free curve" (the risk-free yield curve plus the matched maturity default probabilities for the firm). The credit spreads are volatile because the traded prices provided by TRACE are volatile, even on the same underlying bond on the same day.
(click to enlarge)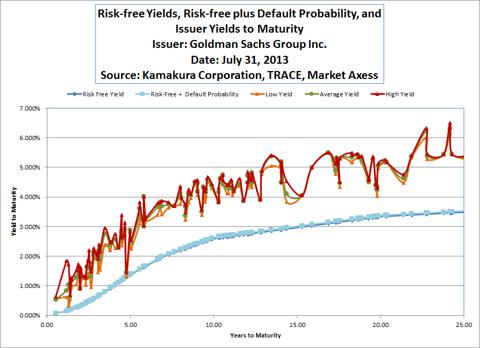
The high, low and average credit spreads at each maturity are graphed below. Credit spreads are gradually increasing with the maturity of the bonds, although the TRACE data shows that credit spreads vary considerably during the day, in part as a function of the amount of bonds bought or sold in a given trade.
(click to enlarge)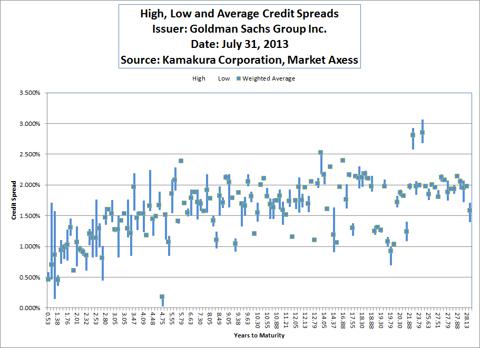
Using default probabilities in addition to credit spreads, we can analyze the number of basis points of credit spread per basis point of default risk at each maturity. This ratio of spread to default probability is shown in the following table for Goldman Sachs Group. At all maturities, the reward from holding the bonds of Goldman Sachs Group, relative to the matched maturity default probability, is at least 25 basis points of credit spread reward for every basis point of default risk incurred. The ratio of spread to default probability is literally "off the charts" at maturities under 2 years because of the near-zero default probabilities for Goldman Sachs Group at those maturities.
(click to enlarge)
(click to enlarge)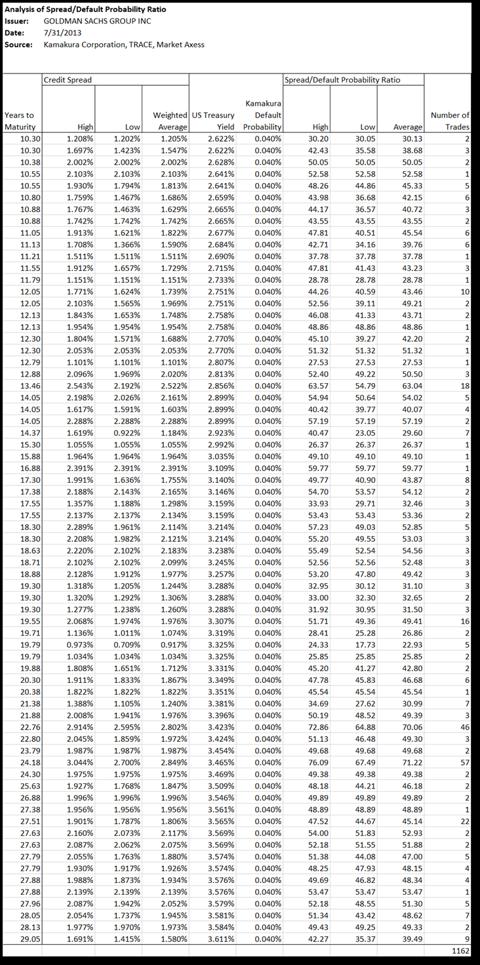
The credit spread to default probability ratios are shown in graphic form here, with the vertical axis capped at a ratio of 100 times:
(click to enlarge)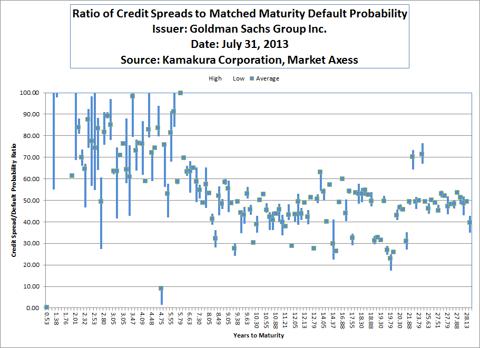
The Depository Trust & Clearing Corporation reports weekly on new credit default swap trading volume by reference name. For the week ended July 26, 2013 (the most recent week for which data is available), the credit default swap trading volume on Goldman Sachs Group showed 25 contracts trading with a notional principal of $191.8 million for the entire week. The next graph shows the weekly number of credit default swaps traded on Goldman Sachs Group in the 155 weeks ended June 28, 2013. Goldman Sachs Group ranked 21st of 1,144 reference names in contracts traded over this period:
(click to enlarge)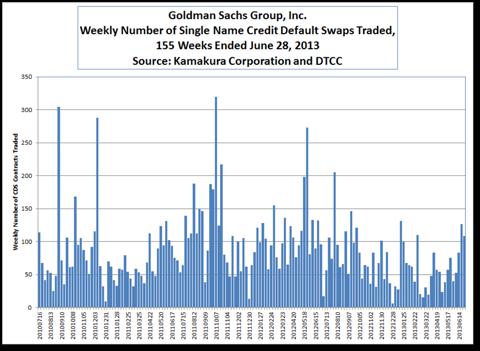
The table below summarizes the key statistics of credit default swap trading in Goldman Sachs Group during this three year period.
(click to enlarge)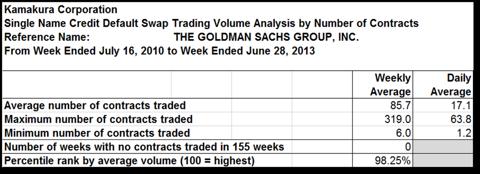
On a cumulative basis, the default probabilities for Goldman Sachs Group range from 0.00% at 1 year (rounded to 2 decimal places) to 0.35% at 10 years, as shown in the following graph.
(click to enlarge)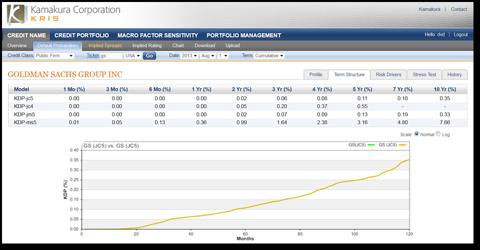
Over the last decade, the 1 year and 5 year default probabilities for Goldman Sachs Group have varied as shown in the following graph. The one year default probability peaked at just under 0.35% and the 5 year default probability peaked at just under 0.25% during that period. This is an exceptional performance rel! ative to ! other securities firms that failed or were rescued during the credit crisis.
(click to enlarge)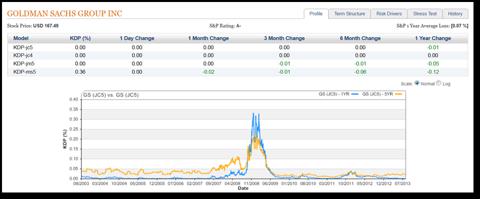
The legacy credit ratings (those reported by credit rating agencies like McGraw-Hill (MHFI) unit Standard & Poor's and Moody's (MCO)) for Goldman Sachs Group have changed only three times during the decade.
The macro-economic factors driving the historical movements in the default probabilities of Goldman Sachs Group include the following factors of those listed by the Federal Reserve in its 2013 Comprehensive Capital Analysis and Review:
Real gross domestic product The consumer price indexThe 30 year fixed rate mortgage yieldThe Dow Jones Industrial indexThe VIX volatility indexHome price indicesCommercial real estate price indices3 international macro factorsThese macro factors explain 85.3% of the variation in the default probability of Goldman Sachs Group, a high proportion.
Goldman Sachs Group can be compared with its peers in the same industry sector, as defined by Morgan Stanley and reported by Compustat. For the US diversified financials sector, Goldman Sachs Group has the following percentile ranking for its default probabilities among its peers at these maturities:
1 month 5th percentile
1 year 6th percentile
3 years 13th percentile
5 years 0th percentile
10 years 0th percentile
Goldman Sachs Group is the least risky of the 220 firms in the US diversified financials sector at 5 and 10 year maturities. A comparison of the legacy credit rating for Goldman Sachs Group with predicted ratings indicates that the statistically predicted rating is 1 ratings notch below the actual legacy rating assigned to the company.
Conclusions
Goldman Sachs was literally the only large U.S. securities firm that survived the credit crisis without (a) borrowing a very significant amount of money from the Federal Reserve and without (b) a near-deat! h experie! nce. A Kamakura Corporation study showed that Goldman's peak borrowings from the Fed during the crisis were $24.2 billion on October 15, 2008. Current short-term default risk is so close to zero that default probabilities are indistinguishable from zero when rounding to two decimal places at one month and one year maturities. The company currently offers more compensation in terms of credit spread per basis point than any other company yet reviewed in this series. Legacy credit ratings for Goldman Sachs Group are one notch higher than that which one would predict using the best available statistics and default probabilities. The main risk facing Goldman Sachs Group is the potential for a sudden failure of risk management, in spite of the firm's fine reputation in this regard. JPMorgan Chase (JPM) had the same such reputation before the London Whale trading losses were announced in 2012. At current default probability levels, we believe that a very strong majority of sophisticated analysts would rate Goldman Sachs Group investment grade by the Comptroller of the Currency definition.
Background on Default Probabilities Used
The Kamakura Risk Information Services version 5.0 Jarrow-Chava reduced form default probability model makes default predictions using a sophisticated combination of financial ratios, stock price history, and macro-economic factors. The version 5.0 model was estimated over the period from 1990 to 2008, and includes the insights of the worst part of the recent credit crisis. Kamakura default probabilities are based on 1.76 million observations and more than 2000 defaults. The term structure of default is constructed by using a related series of econometric relationships estimated on this data base. An overview of the full suite of related default probability models is available here.
General Background on Reduced Form Models
For a general introduction to reduced form credit models, Hilscher, Jarrow and van Deventer (2008) is a good place to begin. Hilscher and Wi! lson (201! 3) have shown that reduced form default probabilities are more accurate than legacy credit ratings by a substantial amount. Van Deventer (2012) explains the benefits and the process for replacing legacy credit ratings with reduced form default probabilities in the credit risk management process. The theoretical basis for reduced form credit models was established by Jarrow and Turnbull (1995) and extended by Jarrow (2001). Shumway (2001) was one of the first researchers to employ logistic regression to estimate reduced form default probabilities. Chava and Jarrow (2004) applied logistic regression to a monthly database of public firms. Campbell, Hilscher and Szilagyi (2008) demonstrated that the reduced form approach to default modeling was substantially more accurate than the Merton model of risky debt. Bharath and Shumway (2008), working completely independently, reached the same conclusions. A follow-on paper by Campbell, Hilscher and Szilagyi (2011) confirmed their earlier conclusions in a paper that was awarded the Markowitz Prize for best paper in the Journal of Investment Management by a judging panel that included Prof. Robert Merton.
Disclosure: I have no positions in any stocks mentioned, and no plans to initiate any positions within the next 72 hours. I wrote this article myself, and it expresses my own opinions. I am not receiving compensation for it. I have no business relationship with any company whose stock is mentioned in this article. (More...)
No comments:
Post a Comment