By Craig Elder, Senior Vice President and Fixed Income Strategist, Robert W. Baird & Co., Inc.
While the Fed’s efforts in maintaining price stability has been very successful largely as the result of former Fed Chair Paul Volker raising interest rates to dramatically lower inflation in the early 1980’s, the efforts in promoting economic growth is not as strong (we are not going to debate the merit of the Fed’s efforts to keep the Great Recession of 2008 from becoming the Great Depression of 2009) but economic growth remains relatively weak coming out of the recent recession.
GDP for the first quarter of 2014 was negative 2.9% but since a part (possibly larger part) of the problem in the first quarter was cold-weather related we doubt that the dating committee will call the first quarter a recession. The weakness in the first quarter raises the question whether economic activity will get to the 2.5%-3.5% range that the Fed prefers for the entire year. We have doubts that that growth will be strong enough in the remainder of the year to offset the first quarter weakness. As of this writing, the consensus forecast and the Fed’s forecast for GDP is growth of 2.2% for 2014. The Fed’s forecast for economic activity in 2015 is 3.1% and 2.75% in 2016 while the consensus street forecast is 3.0% in both years.
Inflation
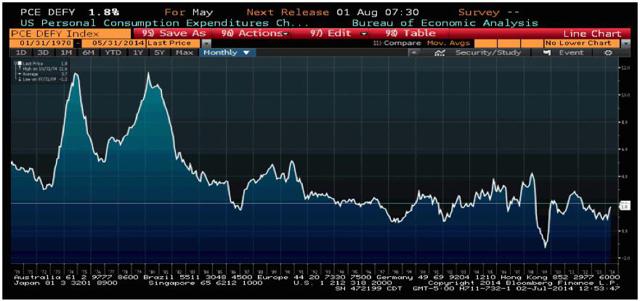
Inflation has not been an issue for the past few years as the Fed’s preferred inflation indicator, the Personal Consumption Expenditures (PCE) Deflator year-over-year, was at 1.8% in May (see Bloomberg chart below). However, that was the highest reading since November 2012 and a jump from 1.1% in March which created some concern among fixed income investors that inflation could be an issue the Fed will have to deal with sooner than later.
As can be seen in the chart that goes back to 1970, inflation had been a severe problem for the American economy for most of the 70’s as we experienced shocks to the economy whe! n oil price spiked higher. President Jimmy Carter appointee to head the Fed, Paul Volker, raised interest rates dramatically in order to lower inflation to acceptable levels. In doing so he also sent the economy into a double-dip recession but the taming of inflation allowed for solid economic growth with no significant inflation concerns for most of the decades 1980’s, 1990’s and 2000’s (with the exceptions of the glitches mentioned earlier in the article).
With economic growth being tepid since 2007, inflation has not been a major concern of the Fed. In fact, some FOMC members have expressed concerns over deflation similar to what has been experienced in Japan and currently feared in Europe. With the higher prints in the PCE deflator recently, deflation is not considered a problem in the U.S.
The Tools of the Federal Reserve
The Fed has three major monetary policy tools to go along with “jawboning”, i.e. communication of their monetary efforts to the markets, at the disposal to promote economic growth and maintain stable prices. The discount rate (however, we will focus on the fed funds target rate), reserve requirement, and open market operations that influence the demand for and supply of balances held at Federal Reserve Banks by depository institutions and ultimately the level of the Federal funds rate (the base rate for the whole economy).
There is a distinction between the Fed funds rate and the discount rate. The Fed funds rate is the interest rate at which depository institutions actively trade balances (excess reserves) held at the Fed or better put, the interest rate charged by commercial banks to other banks that are borrowing money, usually overnight. The Fed funds rate is primarily determined by the balance of supply and demand for the funds. The Fed funds target rate is set by Federal Open Market Committee (FO! MC), ! currently 0.0%-0.25%, but the actual rate that’s used overnight can be higher or lower depending on supply of funds and the demand by banks for loans. The discount window is a term used when banks borrow money from the Fed for themselves—and not for lending to other banks. The interest rate charged on such loans by a central bank is called the discount rate or repo rate. The discount rate is set by the Fed.
Reserve requirements are the amount of funds that a depository institution—a commercial bank—must hold in reserve against specified deposit liabilities. This is to make sure banks have enough funds to cover their liabilities. The banks' reserve funds are held by the Federal Reserve. Please note, this is mostly on paper. No physical money usually changes hands between the banks and the Fed. The dollar amount of a bank’s reserve requirement is determined by applying reserve ratios specified by the Federal Reserve Board to an institution's liabilities. For instance, if a bank has between $13.3 million to $89.0 million in liabilities, it must have funds in the Fed of 3% of the actual total.
Open market operations (OMOs)--the purchase and sale of securities in the open market by a central bank--are a key tool used by the Fed in the implementation of monetary policy. The short-term objective for open market operations is specified by the FOMC. Historically, the Federal Reserve has used OMOs to adjust the supply of reserve balances so as to keep the federal funds rate around the target established by the FOMC.
For the purpose of this report, we will focus on the Fed funds target rate and the asset purchase program (open market operations). The Fed, in an effort to keep the American economy from sliding into a depression or worse (worse being a complete collapse), during the last recession of 2008 & 2009 (unaffectionately called the “Great Recession”) took major and sometimes unprecedented action to boost economic activity. We do not debate whet! her or no! t these actions were needed or not but provide a review of the actions the Fed took.
Asset Purchases
The Fed held between $700 billion and $800 billion of Treasury notes on its balance sheet before the recession. However, in late November 2008, the Federal Reserve started buying $600 billion in mortgage-backed securities (MBS) in an effort to the housing market.
By March 2009, it held $1.75 trillion of bank debt, MBS, and Treasury notes, reaching $2.1 trillion in June 2010. Further purchases were ceased as the economy had started to improve, but resumed in August 2010 when the Fed decided the economy was not growing at an acceptable pace. After the halt in June, holdings started falling naturally as debt matured and holdings were projected to fall to $1.7 trillion by 2012. The Fed's revised goal became to keep holdings at $2.054 trillion. To maintain that level, the Fed bought $30 billion in two-to-ten-year Treasury notes every month.
In November 2010, the Fed announced a second round of quantitative easing, buying $600 billion of Treasuries debt by the end of the second quarter of 2011. This round of stimulus became known by the term "QE2". Retrospectively, the round of quantitative easing preceding QE2 was called "QE1".
On September 21, 2011, the FOMC announced the implementation of Operation Twist. This was a plan to purchase $400 billion of bonds with maturities of 6-to-30 years and to sell bonds with maturities less than 3 years, thereby extending the average maturity of the Fed's own portfolio. This was an attempt to do what Quantitative Easing (QE) tries to do, without printing more money and without expanding the Fed's balance sheet, in an attempt to avoid the inflationary pressure associated with QE. Further, on June 20, 2012 the FOMC announced an extension to the Twist program by adding $267 billion thereby extending it throughout 2012.
A third round of quantitative easing, "QE3", was announced on September 13, 2! 012. In a! n 11–1 vote, the FOMC decided to launch a new $40 billion per month, open-ended bond purchasing program of agency MBS. Because of its open-ended nature, QE3 earned the popular nickname of "QE-Infinity". On December 12, 2012, the FOMC announced an increase in the amount of open-ended purchases from $40 billion to $85 billion per month consisting of $45 billion of Treasury debt and $40 billion of MBS.
On June 19, 2013, Fed Chairman Bernanke announced a "tapering" of some of the Fed's QE policies contingent upon continued positive economic data. Specifically, he said that the Fed could scale back its bond purchases from $85 billion to $65 billion a month during the upcoming September 2013 policy meeting. He also suggested that the bond buying program could wrap up by mid-2014. However, longer-term interest rates spiked higher and Mr. Bernanke and New York Fed President William Dudley went on the speaking circuit (jawboning) in a failed effort to get the yield on the 10-year benchmark Treasury note lower. The Fed held off on scaling back its purchase program until December 2013.
Beginning In 2014 the Fed has been reducing the amount of securities it is purchasing at each meeting with the current asset purchase level at $35 billion consisting of $20 billion of Treasury debt and $15 billion of MBS. It is expected that the Fed will continue to reduce the purchases by $10 billion per meeting until it is out of the bond buying business by the end of 2014.
The Fed currently (as of June 25, 2014) owns $4.09 trillion of securities consisting of $2.38 trillion of Treasury debt, $1.66 trillion of MBS and $43.7 billion of federal agency (debt of Fannie Mae, Freddie Mac and Federal Home Loan Bank). We expect that the Fed will most likely let most of the portfolio “run-off” (mature) over a period of 5-8 years. They do not believe this is the most ideal way of dealing with the holdings but is probably the best option available to them.
Zero-bound Interest Rate! s
T! he Fed lowered the Fed funds target rate to the 0.0%-0.25% range (sometimes called the zero-range bound – ARB) in December 2008. In September 2012, the FOMC announced that it would likely maintain the Fed funds target rate near zero at least through 2015.
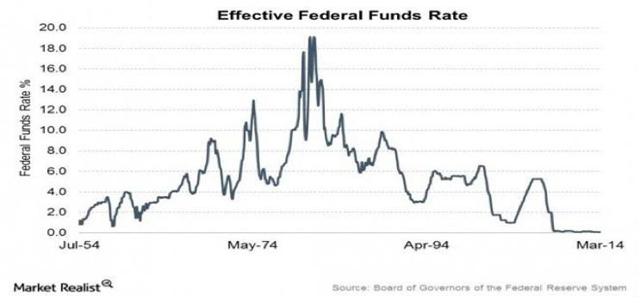
The market tends to focus on the Fed Funds target rate which has been at a zero range bound (ZRB) level (0.0% to 0.25%) since December 2008 (see chart from Market Realist below). Since the vote of the members of the FOMC influence the level of the Fed funds rate, markets are extremely interested in the leanings of FOMC members, which would provide a hint on the timing and level of the base rate. At this time, we believe that the FOMC will vote to begin moving off the ZRB level in mid-year 2015. Also, we expect that the Fed will move slowly, at 0.25% increments to the 2.0% level in late 2016 (absent a spike in inflation levels).
Going Forward
As we have stated above, we believe that the Fed will be out of the bond buying business by the end of this year and are likely to begin normalization of interest rates mid-year next year (best guess at this time would be July 29 meeting). However, we think the Fed will be cautious as they move the funds target rate higher and will only move rates at 25 bps per meeting, possibly skipping some meetings to see the impact of the moves on the economy, with the rate reaching 2.0% by the middle of 2016 as they head toward the central bank’s long-term rate range of 3.75%-4.00%.
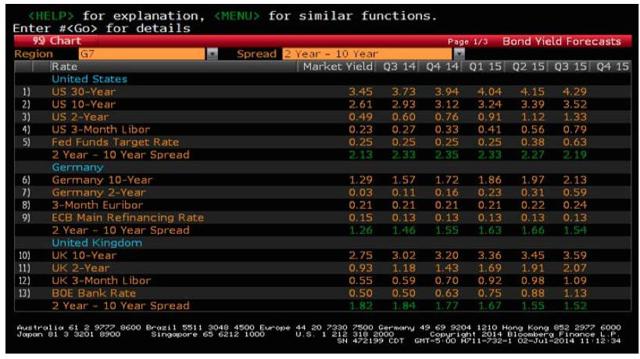
Below is a 2014 year-end forecast of the yield curve based on the consensus forecast from CreditSights. While we believe this is likely the shape of the yield curve at the end of the year, we think there is a chance that the curve will be flatter than the consensus (see table below) forecast with the 2s/10s spread moving towards the normal range of 90-120 bps.

Sources: Bloomberg, CreditSights, Federal Reserve, Market Realist
Disclosures: Baird may from time to time have a proprietary position in the debt obligations of the issuers mentioned in the report. This report is for information purposes only and in no event should it be construed as a solicitation or offer to purchase or sell a security. The information presented herein is taken from sources believed to be reliable, but we do not guarantee the accuracy or completeness. Any issue named or rates mentioned are used for illustrative purposes only and may not represent specific features or securities available at a given time. The value of and income from investments may vary because of changes in interest rates, foreign exchange rates, securities prices, market indexes, operational or financial conditions of the issuers, or other factors. Past performance is not a guarantee on future performance. Preliminary Official Statements, Final Official Statements, or Prospectuses for new issues mentioned herein are available upon request. For more information regarding municipal securities, visit emma.msrb.org.
This report does not provide recipients with information or advice that is sufficient on which to base an investment decision. This report does not take into account the specific investment objectives, financial situation, or need of any particular client and may not be suitable for all types of investors. Recipients should consider the contents of this report as a single factor in making an investment decision. Additional fundamental and other analyses would be required to make an investment decision about any individual security identified in this report.
For investment advice specific to your situation, or for additional information, please contact your Robert W. Baird Fin! ancial Ad! visor and/or your tax or legal advisor.
Copyright 2014 Robert W. Baird & Co. Incorporated.
Other Disclosures
UK disclosure requirements for the purpose of distributing this research into the UK and other countries for which Robert W. Baird Limited holds an ISD passport.
This report is for distribution into the United Kingdom only to persons who fall within Article 19 or Article 49(2) of the Financial Services and Markets Act 2000 (financial promotion) order 2001 being persons who are investment professionals and may not be distributed to private clients. Issued in the United Kingdom by Robert W. Baird Limited, which has offices at Mint House 77 Mansell Street, London, E1 8AF, and is a company authorized and regulated by the Financial Conduct Authority. For the purposes of the Financial Conduct Authority requirements, this investment research report is classified as objective. Robert W. Baird Limited ("RWBL") is exempt from the requirement to hold an Australian financial services license. RWBL is regulated by the Financial Conduct Authority ("FCA") under UK laws and those laws may differ from Australian laws. This document has been prepared in accordance with FCA requirements and not Australian laws.
Source: The Federal Reserve And The Relationship With The Economy Read more on Dividend Investing » Read more on Alternative Investing » Research ETFs for your portfolio with the new ETF Hub » Robert W. Baird & Co. (4 followers) Investment strategist You will now receive new articles by this author via email. Manage your settings »
We only use your contact details to reply to your request for more information.We do not sell the personal contact data you submit to anyone else.
Thank you for your interest in Seeking Alpha PRO We look forward to contacting you shortly for a conversation. Thank you for your interest in Seeking Alpha PRO Our PRO subscription service was created for fund managers, and the cost of the product is prohibitive for most individual investors. At this time, we do not yet have a subscription product for individual investors. If you'd like us to contact you when it's ready, please click here. If you are an investment professional with over $1M AUM and received this message in error, click here and you will be contacted shortly. Thank you for your interest in Seeking Alpha PRO We look forward to contacting you when we have an individual investor product ready! Already subscribed to PRO? Sign in here
No comments:
Post a Comment